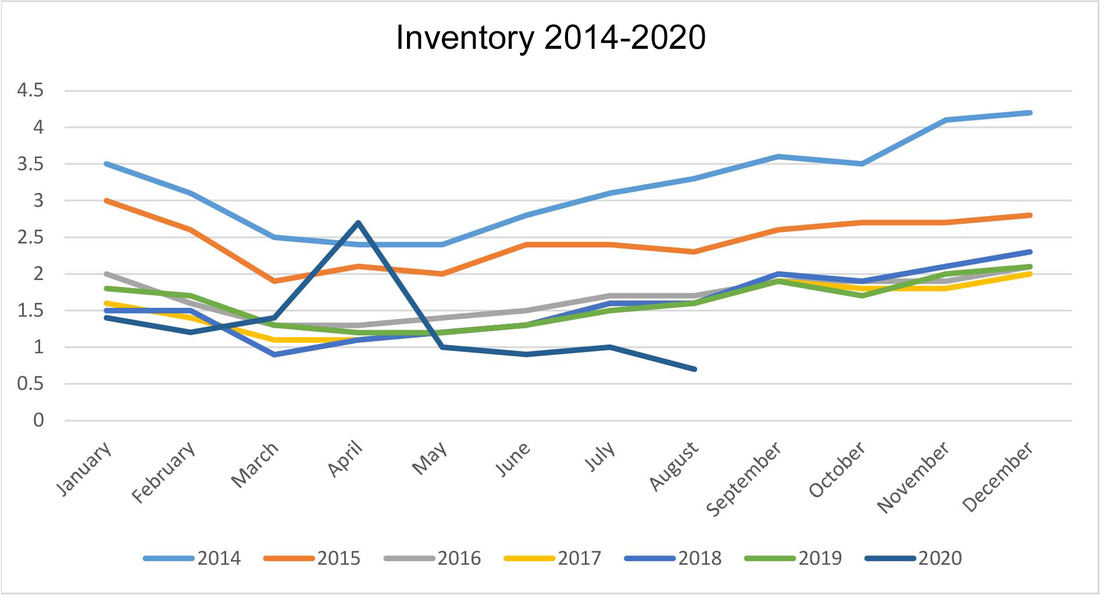
 For the last three years, the real estate market has held steady with almost identical monthly inventory levels. In true 2020 fashion, this year isn't following suit. While 2020 continues to be a hot seller's market, the monthly inventory levels have been quite different this year. Before getting into the nitty gritty of inventory numbers, let's look at some general information first. The number of sales is actually down 5.2% compared to last year, but volume is up slightly by 0.6%. High demand for housing and lack of inventory continue to drive up prices. The average sale price so far this year is $263,338, an 8.3% increase above last year. Interest rates have helped keep demand high. Rates are at an all-time low, and are currently about 2.9% for 30-year loans and 2.5% for a 15 year. Inventory level is a measure of whether the market is a buyer or seller's market. This number is determined by figuring how long it would take to sell through the current number of homes on the market at the current rate they are selling, assuming no new houses hit the market. 5-6 months of inventory is considered a balanced market. Back in 2008, inventory was as high as 13 months. If you look at the graph below which tracks the monthly inventory levels, you can see we jumped to 2.7 while shut down. That is the highest inventory level since 2015. Sellers didn't have as much power during this time because many buyers fell out of the market when they couldn't look at homes in person. Real estate was operating in very limited capacity from 3/23-5/6 during the stay-at-home order, but rebounded immediately after opening back up. All of that was pretty much as expected. What is surprising though is August had the lowest level of inventory EVER. All we had for all of the greater Grand Rapids area was 0.7 months. This is suprising because inventory levels have been almost identical month-to-month for the last three years straight. It shows very clearly there is an insatiable demand for housing in our area, especially afordable housing. Generally, anything under $300k is high demand. Higher end homes can still sell quickly, but it is not the same frenzy the lower price ranges are experiencing. If you are curious to see the inventory levels broken down by school district and price range, please check out the attached pdf file. Some of the notably lowest inventory levels are in the $150-250k range, especially in Metro GR and Wyoming areas. The low inventory numbers seem to be spreading out farther away from the city center as well. 2020 has been a weird year, so I am not going to try to predict anything from these stats. We may have further economic repercussions due to Covid-19 and the upcoming election. One thing I know for sure, is the lack of housing supply will not be solved quickly. For now, prices continue to rise as buyers fight agressively over houses.
1 Comment
2/17/2022 10:13:55 pm
The industry experienced significant uncertainty and negative impacts early on, then responded with significant changes and adaptations, leading to a year of unprecedented and unexpected activity and growth. Leave a Reply. |
Lisa VanderLooGreat info on everything real estate. Categories
All
Archives
November 2023
|
||
 RSS Feed

|
© COPYRIGHT 2020. ALL RIGHTS RESERVED.
|